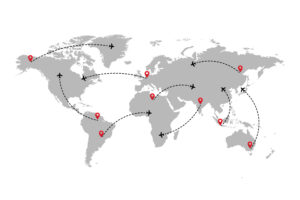
Multi country inventory planning decides where stock should sit, how much each market needs and when to replenish it. It also sets which node fulfills each order. When the plan matches every market to the model that fits its volume and margin, international growth keeps its profit.
The stakes show up quickly in checkout data. In a February 2024 Baymard survey of 1,012 US adults, 48% said extra costs had made them abandon a cart. Those costs include shipping, tax and fees. Stock in the wrong country adds them through express freight, customs delays, duties and returns. It also weakens the delivery promise.
A US brand can see strong demand in the UK, Mexico and the EU and still lose money abroad. Shipping every order from a domestic warehouse looks simple on a spreadsheet. However, freight, duties, returns and weak conversion can change the economics fast.
Why Multi Country Inventory Planning Changes the Economics
International demand does not automatically justify local stock. A market may generate enough orders to deserve localized checkout, duty calculation and local carriers. Even so, it can stay too small or too volatile for a dedicated inventory position. On the other hand, predictable sales can still be costly to serve cross border. Direct shipping seems to avoid local operating costs, but the savings can disappear per parcel.
The right choice depends on full landed cost. That includes inbound freight, storage, pick and pack, and domestic delivery. It also covers customs clearance, duties and taxes, return handling, inventory financing and stockouts. Holding stock has a price of its own, too. APQC and ISM benchmarks, as summarized by Six Sigma DSI, put annual carrying cost at 20% to 30% of inventory value. In a hypothetical case, $200,000 of stock in one market costs $40,000 to $60,000 a year to hold.
Product mix matters as well. Lightweight, high margin beauty products can serve early demand cross border for longer. Bulky, lower margin home goods usually cannot. Likewise, a SKU with stable demand is easier to place locally than a seasonal assortment with uncertain sell through. Therefore, the plan should reflect those differences instead of applying one fulfillment rule to every SKU and country.
Compare the Two Models Line by Line
Before assigning stock, put both models on the same cost sheet. Table 1 summarizes how a home warehouse and regional stock differ on the lines that move margin.
Table 1. What each model puts on the cost sheet
| Cost line | Cross border from a home warehouse | Regional stock |
|---|---|---|
| Delivery time | 5 to 15 business days, according to Stord | 1 to 3 business days, according to Stord |
| Freight | Paid per parcel at international rates | Paid in bulk on inbound replenishment, then local delivery |
| Customs and duties | Handled on every parcel | Handled on the inbound shipment, with local tax setup |
| Capital | Stays in one stock pool | Spread across nodes, with carrying cost of 20% to 30% a year |
| Returns | Cross the border twice unless a local route exists | Can be received locally |
| Main risk | Slow delivery and surprise charges | The wrong SKU in the wrong country |
Build the Network Around Demand, Not Borders
Country by country allocation is often too narrow. The practical question is whether a regional node can reach target customers within an acceptable window and cost. It must also meet local compliance rules. For example, one EU inventory position may serve several member states, subject to the business’s VAT, invoicing and fulfillment structure. A US distribution center, by contrast, suits domestic demand and selected international orders. It is not automatically the right source for Canadian, Latin American or European customers. Each lane has its own transit, customs, carrier and return economics.
Start by defining service tiers. Then move a market up a tier only when demand has earned the working capital. This sequence prevents a common expansion mistake: opening inventory positions in too many countries too early.
Table 2. Service tiers for a multi country network
| Tier | Market profile | Inventory model | Delivery promise |
|---|---|---|---|
| Tier 1 | High volume, stable demand | Local or regional stock | Two to four days |
| Tier 2 | Emerging, growing demand | Cross border fulfillment until a defined threshold is met | Set accurately at checkout |
| Tier 3 | Long tail, low volume | Central stock, with duties shown upfront | Set accurately at checkout |
Segment Products Before Assigning Stock
The same market can need different strategies by product. Classify SKUs by demand velocity, gross margin, size and weight, replenishment lead time, customs sensitivity and return rate.
Fast moving products with dependable demand are strong candidates for regional stock. Slow moving or high variation products often belong in a central location until their pattern becomes clearer. Distributing every SKU everywhere raises working capital and makes replenishment harder. If too little stock sits locally, however, top sellers run out while low value items occupy shelf space. The goal is the right availability at a lower total cost to serve, not maximum distribution.
Table 3. Placement by SKU profile
| SKU profile | Signals | Typical placement |
|---|---|---|
| Fast moving, dependable demand | High velocity, stable forecast | Regional stock |
| Slow moving or high variation | Uncertain sell through | Central stock until demand is clearer |
| Bulky or low margin | High freight per unit, thin contribution | Model landed margin first, then test |
| Special documentation | Batteries, controlled ingredients, country specific labels | Separate route with its own compliance steps |
| High return rate | Sizing or fit issues | Model return handling before placing stock |
Set a Break Even Point With Your Own Numbers
Cross border cost scales with every parcel. Regional stock works the other way: it front loads cost, then flattens it, according to Landmark Global. The crossing point between the two is the threshold to find. Take a hypothetical market. Cross border costs $25 per order. Regional stock costs $4,500 a month in fixed costs, plus $16 per order. The two costs meet at 500 orders a month.
Provider guidance on this threshold varies. ShipBob suggests considering in country fulfillment when international orders exceed 15% to 20% of total volume in a specific country. ShipMonk, in contrast, points to 500 to 1,000 orders a month to one country. In that range, local savings usually outweigh storage costs. Both are vendor views, not rules. The gap between them shows why each brand needs its own math.
Use Reorder Logic That Reflects Cross Border Reality
A domestic reorder point built only on recent sales and supplier lead time falls short in a multi country network. International replenishment adds production schedules, port or airport capacity, customs processing, transfer lead times and local receiving limits. Each node therefore needs its own reorder point, set by market and SKU instead of a blanket target.
The reorder point equals average daily demand multiplied by lead time in days, plus safety stock. Safety stock multiplies three inputs: the z score for your service level, daily demand variability and the square root of lead time. Table 4 applies this to one hypothetical SKU in two markets.
Table 4. Hypothetical reorder points for the same SKU (95% service level, z of 1.65)
| Input or result | Market A, reliable lane | Market B, longer and less predictable lane |
|---|---|---|
| Average daily demand | 12 units | 12 units |
| Standard deviation of daily demand | 4 units | 6 units |
| Replenishment lead time | 20 days | 45 days |
| Safety stock | 30 units | 66 units |
| Reorder point | 270 units | 606 units |
Demand is identical, yet Market B needs more than twice the reorder point. This simplified version covers demand variability only, so real lead time variability would add more buffer. Safety stock should reflect uncertainty, not anxiety. Excess stock can hide weak forecasting for a while. Eventually it brings markdown exposure, storage costs and trapped capital.
Write Transfer Rules Before the First Stockout
Moving stock between markets can solve a short term stockout. However, it can also create new customs, tax, ownership and documentation duties. Before the first stockout, decide when a transfer is justified. Also decide who owns the movement and how the goods are valued and recorded.
Connect Inventory Placement to Tax and Fulfillment Structure
Placing inventory in a country can create obligations beyond warehousing. Depending on the market and operating model, it may affect VAT or sales tax registration and local invoicing. Customs representation, entity structure, product compliance and fiscal reporting can change too. For that reason, supply chain cannot own the decision alone.
Finance, tax, ecommerce, customer experience and logistics all shape the final model. The commercial team wants faster delivery in a new market. Finance needs clarity on who imports the goods and issues invoices. Operations needs a repeatable process for receiving, shipping, returns and exceptions.
Effective teams map the flow of goods, funds, data and legal responsibility for each route before inventory lands. Then they decide whether stock will be sold locally or imported through a merchant of record or importer of record structure. The alternative is cross border shipping under delivery duty paid terms. Each answer changes the cost base and the customer experience. For the tooling side of that decision, see this guide to categories of import management software.
Track Metrics That Reveal Placement Problems
Measure performance by lane, market and SKU. Overall inventory turns can look healthy while one country stays overstocked or leans on emergency shipments. Track stock availability, days of supply, forecast accuracy and sell through. Add fulfillment cost per order, inbound transfer cost, delivery time, return rate and landed margin.
Inventory aging by location deserves attention too, especially for seasonal or localized assortments. A product sitting in the wrong market may need a costly transfer, a local markdown or disposal. Finally, compare promised delivery dates with actual performance. A market may meet stock targets yet miss delivery promises because of carrier handoffs or customs clearance. In that case, the placement decision still needs work.
Start With a Pilot, Then Expand
A few strong weeks of sales should not trigger localization. Set thresholds that combine order volume, forecast confidence, gross margin, service needs and expected payback. For example, a brand may hold regional stock only after three conditions are met. Demand must last several replenishment cycles. Contribution margin must reach target after local fulfillment costs. Faster delivery must also lift conversion or retention.
A pilot is often the safest first move. Begin with a narrow group of proven SKUs, define inventory limits and monitor sell through and delivery outcomes. Then widen the assortment once performance supports the next commitment. This approach preserves speed to market without turning every new country into a permanent warehouse decision.
How Ship Fulfillment, Ship Tax & Duty and Ship Clear Fit In
Ship Fulfillment operates through hubs in Latin America, the United States and Europe. It receives inventory, stores it, picks and packs orders and ships locally, with inventory management, inspection and palletization. Ship Tax & Duty calculates import duties and taxes in real time for every order, using cart data and destination. It also supports DDP operations.
Ship Clear suits brands that sell while ShipSmart handles the destination country’s fiscal and regulatory structure. It runs a B2B2C model with DDP invoices issued through a local merchant of record. Together, these products help teams run the chosen model without managing disconnected providers in every market.
What is multi country inventory planning?
It is the practice of deciding which markets get local stock and how much each needs. It also sets when to replenish and which node fulfills each order. The goal is the right availability at a lower total landed cost.
When should a brand move from cross border shipping to regional stock?
Move when a market shows sustained demand and a clear contribution margin after local fulfillment costs. Faster delivery should also lift conversion or retention. Provider guidance ranges from 15% to 20% of volume in a country to 500 to 1,000 orders a month. Test the threshold with your own numbers.
How do you calculate a reorder point for each market?
Multiply average daily demand by lead time, then add safety stock sized to demand variability and service level. Run the calculation by market and SKU instead of using one weeks of cover rule.
Does placing inventory in another country create tax obligations?
It can. Depending on the market and model, local stock may affect VAT or sales tax registration, invoicing and fiscal reporting. Confirm the structure with your tax advisors before inventory lands.
Multi country inventory planning works when each market receives the position that fits its stage of growth. If it makes sense, our team can work as an extension of yours. Together, we can review your lanes, landed costs and fulfillment options. You can book a conversation or explore Ship Fulfillment first. For each market, ask which inventory position gives customers a good experience and keeps contribution margin healthy at the current stage.